If you’re a property owner, it’s good to be in an area with a recently approved community plan but it's not so great for residential and commercial renters or established businesses.
The relationship between planning and land values is illustrated in Andy Yan's latest analysis of property assessment data.
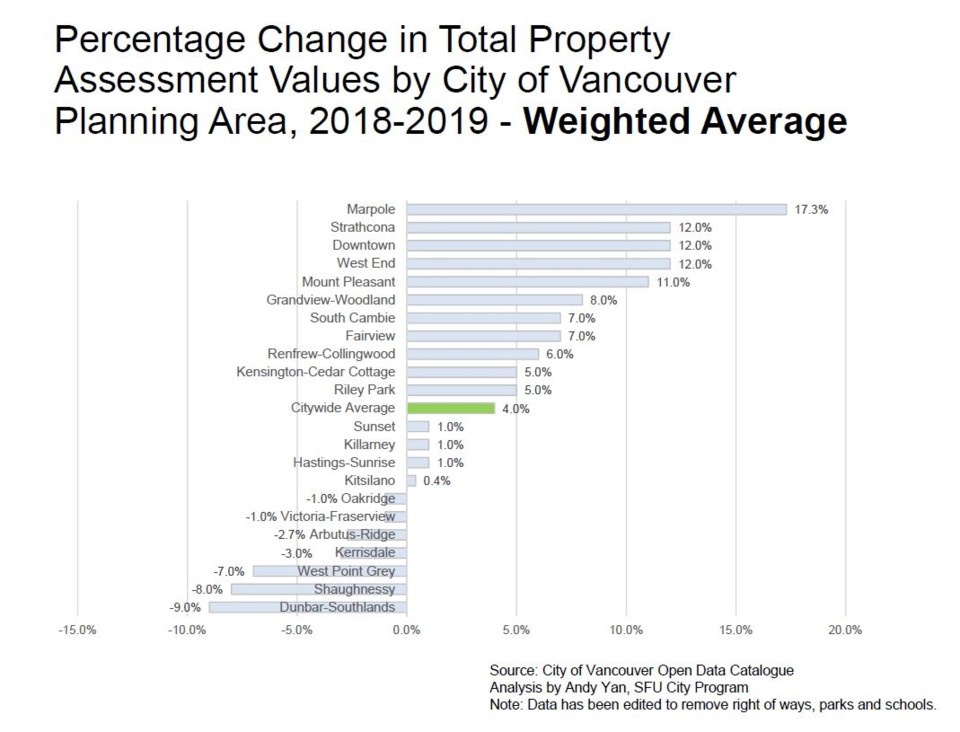
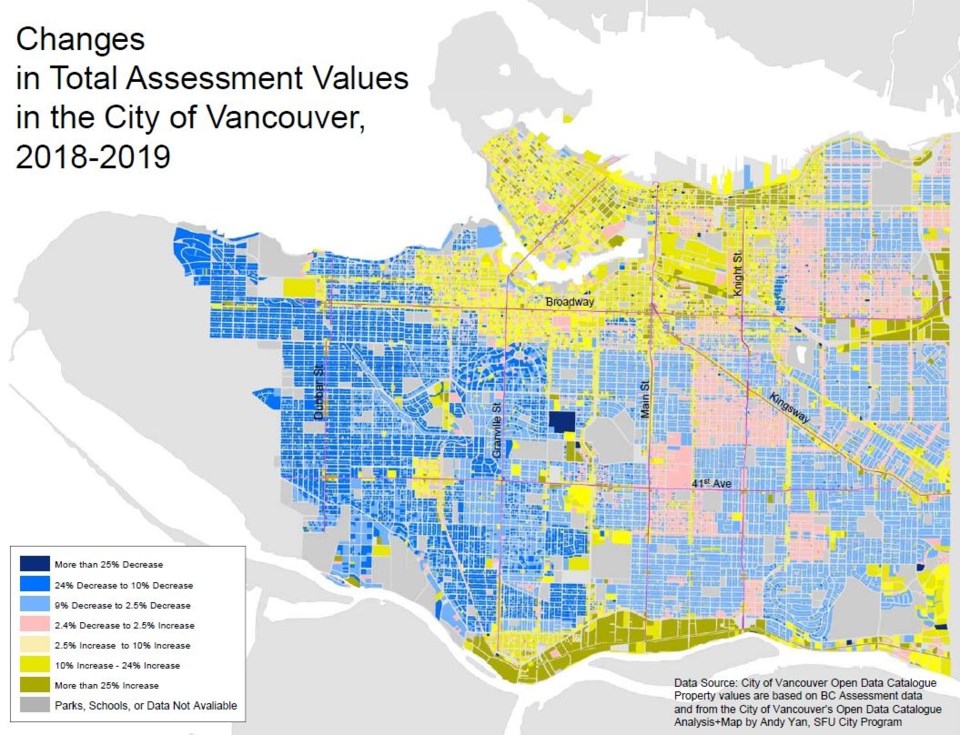
The percentage change in total assessment values by City of Vancouver planning area in 2018-2019 was highest in neighbourhoods with relatively new community plans, while there was a decline of 10 to 24 per cent in property values on the West Side and a two-and-a-half to five per cent drop on the East Side. Parts of downtown, as well as the industrial lands in the City of Vancouver, soared in prices.
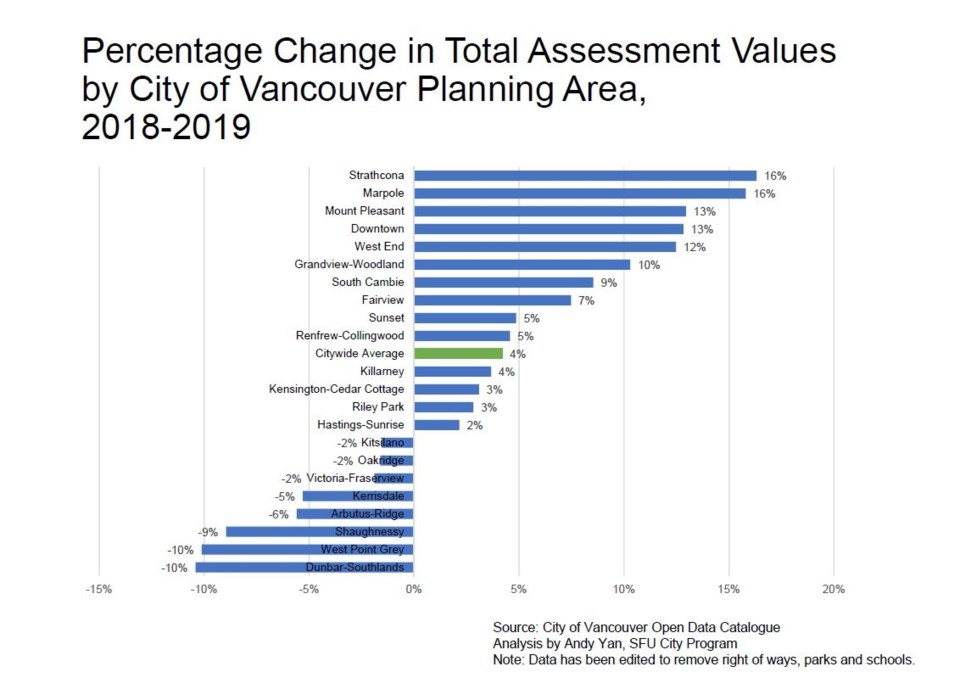
In terms of planning areas, Strathcona’s total assessment values went up by 16 per cent, as did ones in Marpole, while in Mount Pleasant and Downtown they increased by 13 per cent, the West End by 12 per cent and Grandview-Woodland by 10 per cent.
The Downtown Eastside’s (Strathcona) community plan was adopted in 2014, Marpole’s in 2014, Mount Pleasant’s in 2010, the West End’s in 2014 and Grandview-Woodland’s in 2016.
"It’s [about] understanding the economics and land value consequences of these types of planning programs — that they invariably have an effect on land values and, in turn, the people who live and work on them," Yan said.
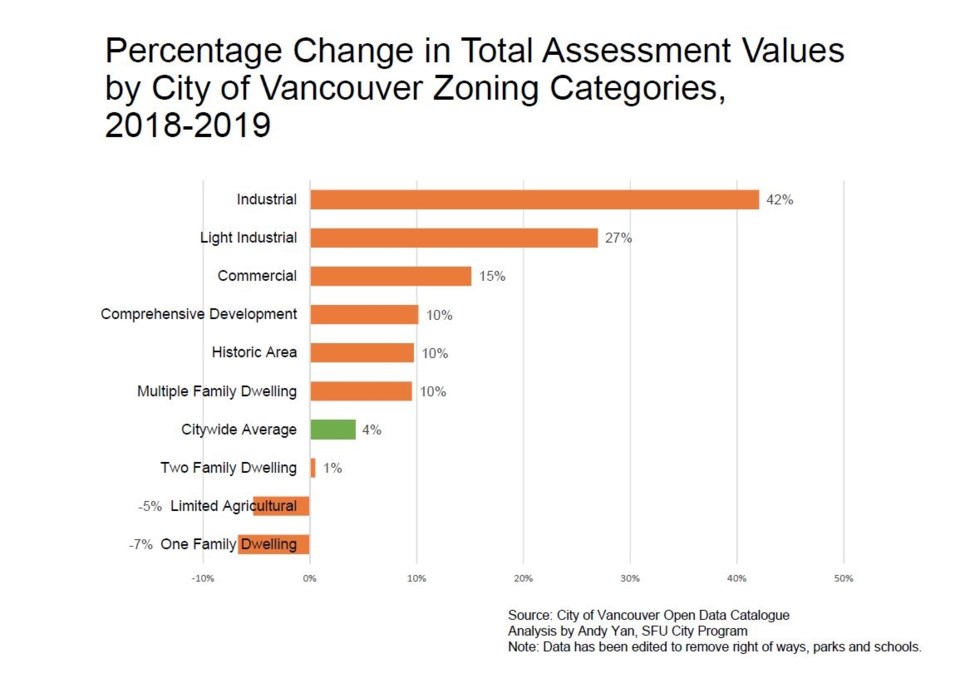
"If you look at the breakdown in neighbourhoods, you see a very distinct pattern. Downtown Vancouver is actually an interesting example… it’s all been moved into flexible zoning, in terms of it being a version of CD-1 [comprehensive development district] in one form or another, but if you look at everywhere from Grandview-Woodlands to Strathcona, these are all neighbourhoods that recently received a community plan."
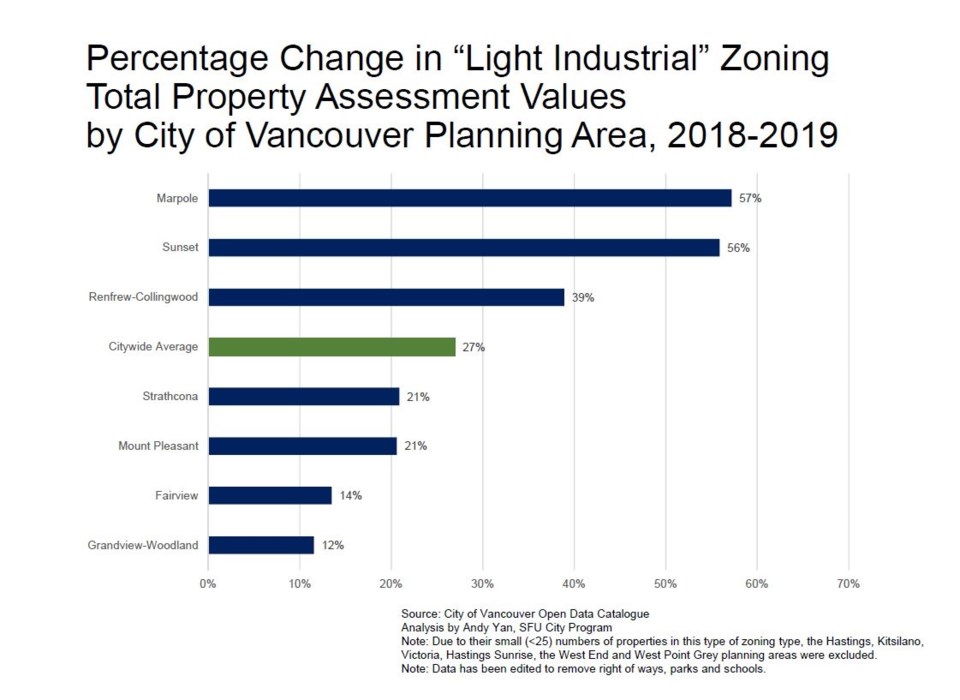
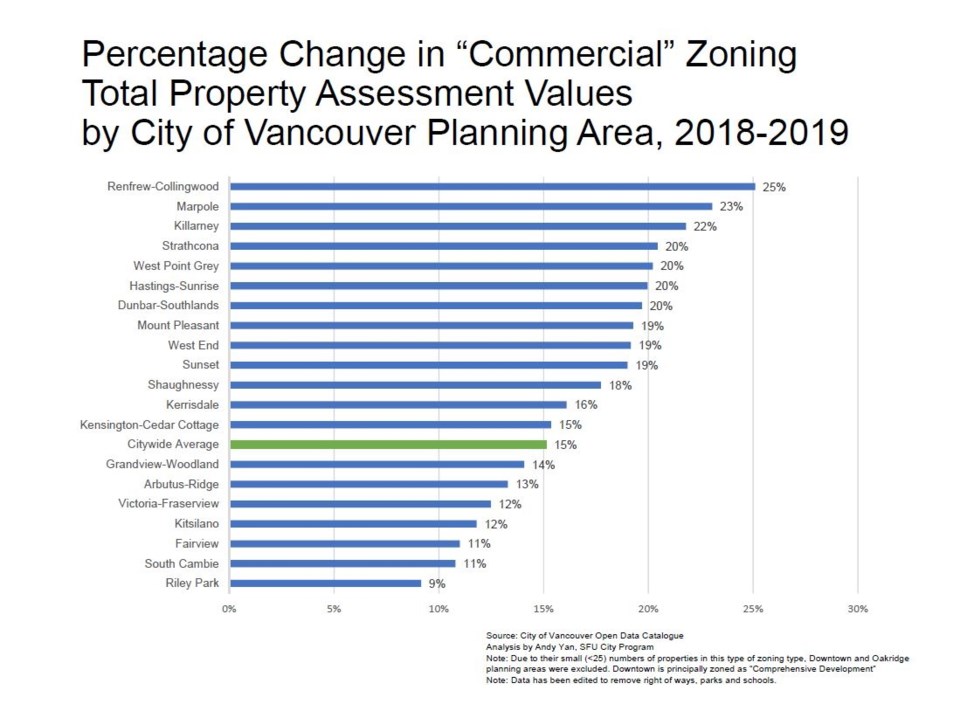
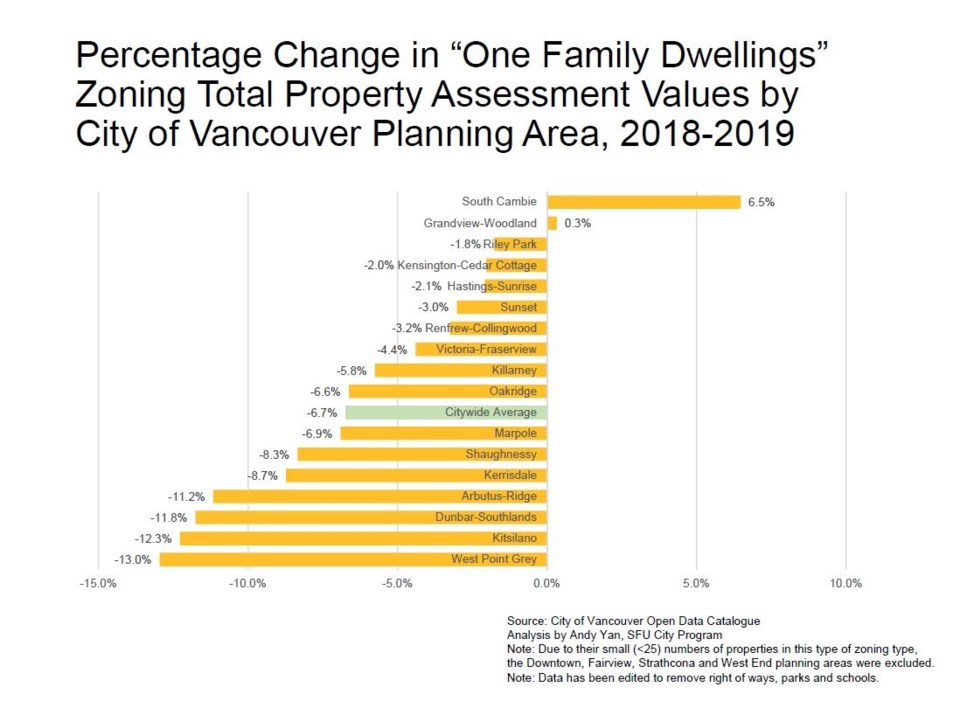
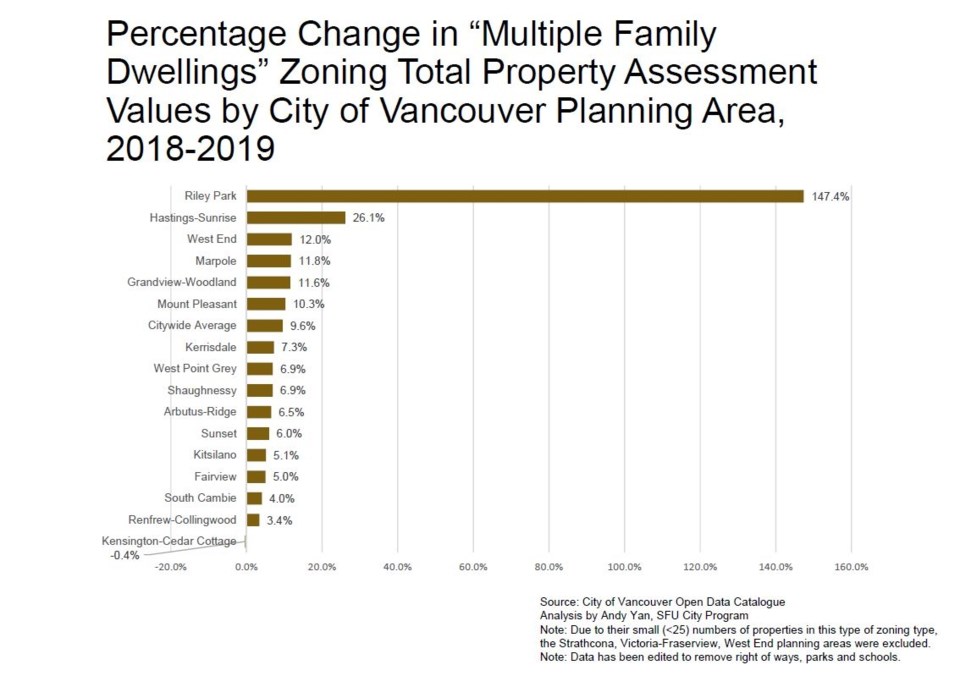
Yan noted that while properties in planning areas with new community plans did go up, they weren’t necessarily uniform across all zoning types in each planning area. For example, while properties in Marpole, on average, went up 16 per cent, light industrial properties in that area went up 57 per cent and one-family dwellings went down seven per cent.
While increases to assessed values are lucrative for property owners or speculators who want to sell, renters and those holding leases face significant costs.
"The takeaway is the connection between planning and land values. It really is a windfall for some property owners yet it risks being a hurricane for renters — and that's both commercial and residential," Yan told the Courier.
"... On the eve of the city-wide plan, you better have the mechanisms to shelter renters, commercial and residential renters, as well as established businesses. That is really the lesson out of this particular analysis."
A citywide plan is the development stages for Vancouver. Its objective is to create a vision for the city and more certainty around development and land use.
Yan's analysis is part of a series of analyses on Vancouver property values that he's been doing in the City of Vancouver since 2009, beginning with a study of the $1-million line in single-family homes, which he produced while working at Bing Thom Architects.
"Since nearly every single-family home in the City of Vancouver is over $1 million since 2017 and ended that analysis, this particular examination pivots to look at all types of land use by planning area," he said.
Yan said more research is needed to understand the consequences of planning programs and what measures can be put in place to mitigate negative consequences.
That said, he said it's difficult to predict what will happen to land values in the future in light of the upcoming federal election, the changing global environment, the fluid finance situation, a possible increase in interest rates, the increasing difficulty in obtaining credit and the cooling down of sales.
"Basically, cheap, fast and global capital are all in flux in Vancouver. Before, when they were all lined up, that helped power the property tax increases in Vancouver but now that the alignment is ajar, what happens to land prices is going to be interesting to watch over the next year — is this a break in the weather or is this climate change." he said.
