In the current slowing real estate market, it’s easy to read the headlines and imagine that sales are plummeting all over the region and it’s becoming a buyer’s market. But that’s not necessarily true of all areas – or all property types.
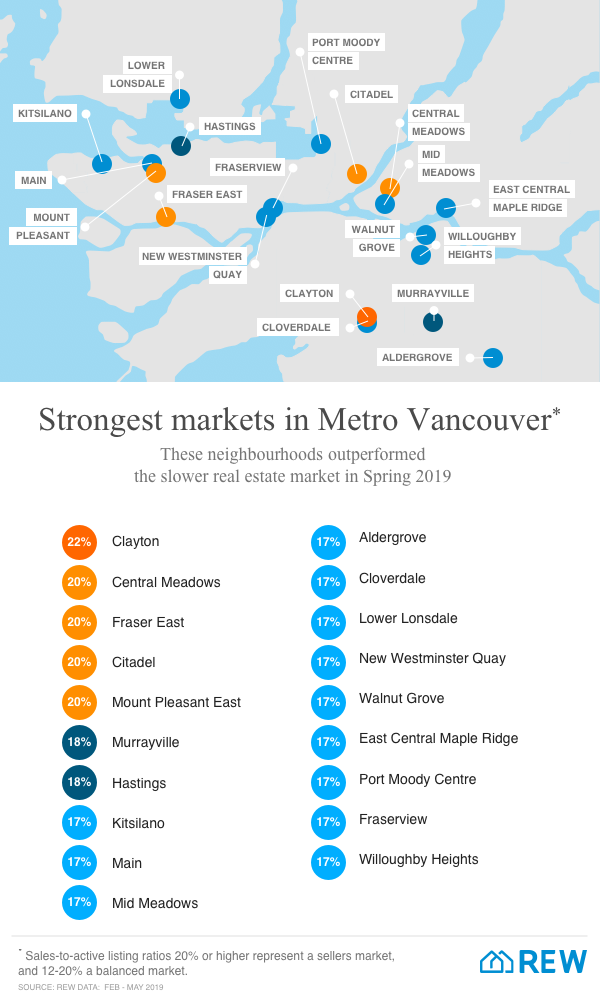
This infographic by our sister website REW.ca reveals where in Metro Vancouver has remained a strong market for real estate activity this spring – and some areas that have even remained a seller’s market.
The study of real estate activity from February to May 2019 looks at the sales-to-active-listings ratio (SAR) in each area, for all property types combined. A figure over 20 per cent indicates a seller’s market, while 12 to 20 per cent is a balanced market, and below 12 is a buyer’s market.
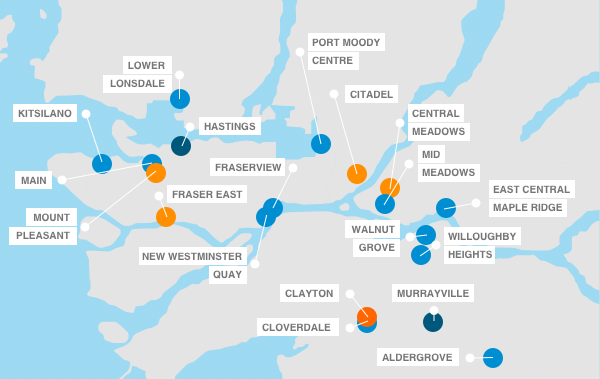
The study found 19 neighbourhoods with an SAR of 17 per cent or more, indicating solid activity. The hottest area was in Clayton, Surrey (22 per cent) followed by Central Meadows in Pitt Meadows, Fraser East in Vancouver, Citadel in Port Coquitlam and Mount Pleasant East in Vancouver – all at 20 per cent.
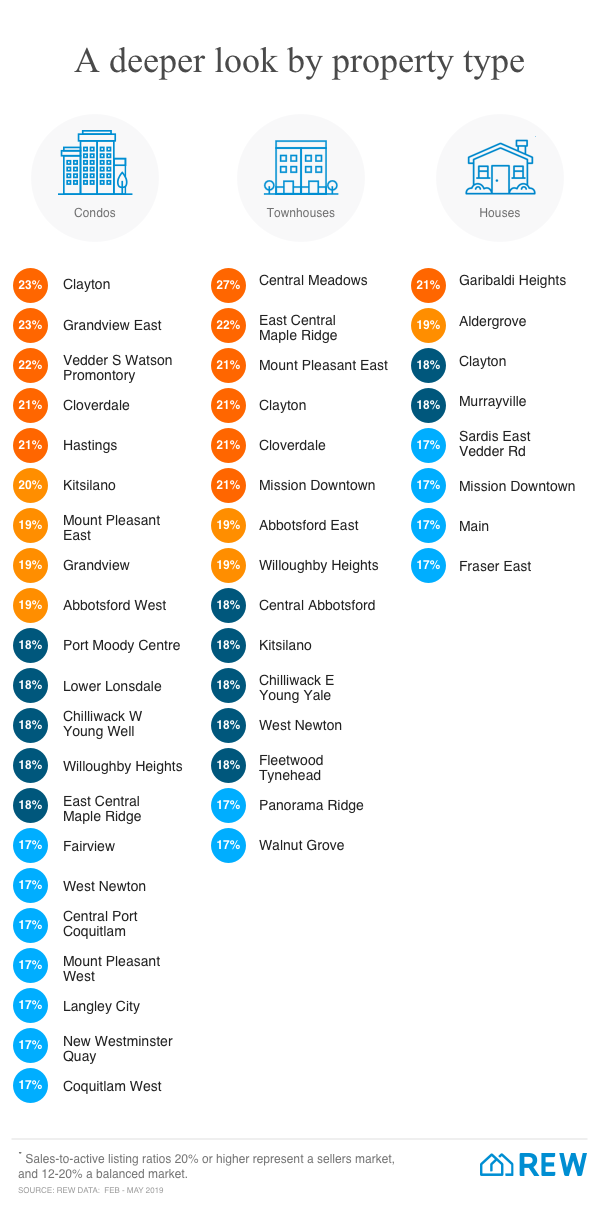
The study also broke out SAR by individual property type to find the strongest markets for detached house, townhome and condo sales.
Check out the infographics and see if your neighbourhood is on the list, below.


